1 数据说明:
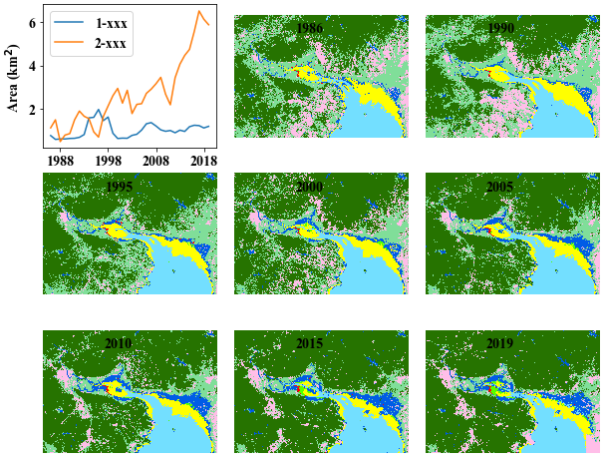
land_site06.tif 是通过 GEE 处理好的土地利用分类tif格式数据,其中有34个波段,每个波段代表某个年份地物分类情况,一共8种地物类别
2 安装对应的包
-
需要先下载: Fiona,Gdal,Pyproj,Shapely的whl文件,然后用pip3 install *.whl 进行安装
-
在安装 Gdal 之前,必须先安装Pyproj、Shapel、yFiona
3 结果展示

4 代码展示
import gdal

import numpy as np

import matplotlib.pyplot as plt

import matplotlib.colors as colors

import matplotlib

import pandas as pd

# 控制字体的大小和字体的样式

font = {'family':'Times New Roman', 'weight':'bold', 'size':14}

plt.rcParams['font.sans-serif'] = 'Times New Roman'

plt.rcParams['axes.unicode_minus'] = False

matplotlib.rc('font', **font)

# 自定义颜色

def colormap():

# color

cdict = np.array([(255,0,0), (85,255,0), (255,255,0), (115,223,255),(38,115,0),

(255,190,232),(128,222,153),(0,92,230)])/255

# 按照上面定义的colordict,将数据分成对应的部分,indexed:代表顺序

return colors.ListedColormap(cdict, 'indexed',8)

my_cmap = colormap()

# 读取tif

file = "../data/land_site06.tif"

raster = gdal.Open(file)

rasterArray = raster.ReadAsArray()

# 统计tif的面积

tmp = {i:(rasterArray.reshape(34,-1)==i).sum(1) for i in range(1,8)}

area = pd.DataFrame(tmp)

area["time"] = range(1986,2020)

area = area.set_index("time",drop=True)

# 画图展示

kw = dict(linewidth = 2,markerfacecolor='none',markersize = 4)

fig, axes = plt.subplots(3, 3, figsize=(10, 8))

axes = axes.ravel()

# 第一个子图是面积变化

h1,h2 = axes[0].plot(area[[1,2]]/1e6*900)

axes[0].set_xticks([1988,1998,2008,2018])

axes[0].legend([h1,h2],['1-xxx','2-xxx'])

axes[0].set_ylabel('Area (km$^2$)')

# 其它小图是空间分布

for index,year in enumerate([1986,1990,1995,2000,2005,2010,2015,2019]):

band = rasterArray[year-1986,:,:]

rasterArray[rasterArray==0]=8 # 小问题,0分类也是其它类别

H = axes[index+1].imshow(band,cmap=my_cmap)

axes[index+1].set_yticks([])

axes[index+1].set_xticks([])

axes[index+1].axis('off')

title_x = band.shape[0]

title_y = band.shape[1]

axes[index+1].text(title_x/2,title_y*0.1,year)

plt.subplots_adjust(wspace=0.1, hspace=0.1,top = 0.9,bottom = 0.1)

plt.savefig('tif分类数据py.png', dpi=800,format= "png",facecolor=None, edgecolor='Black')