1. 数据
-
数据说明:直接利用modis的产品数据mcd12q1v006进行统计
-
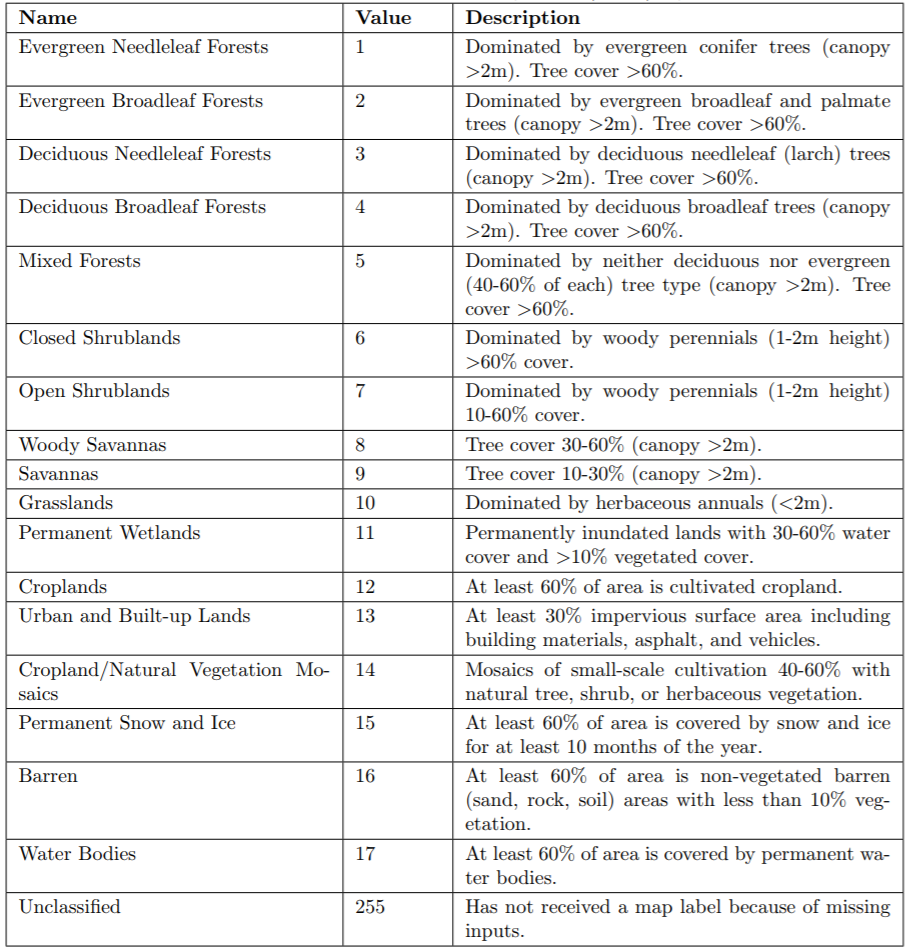
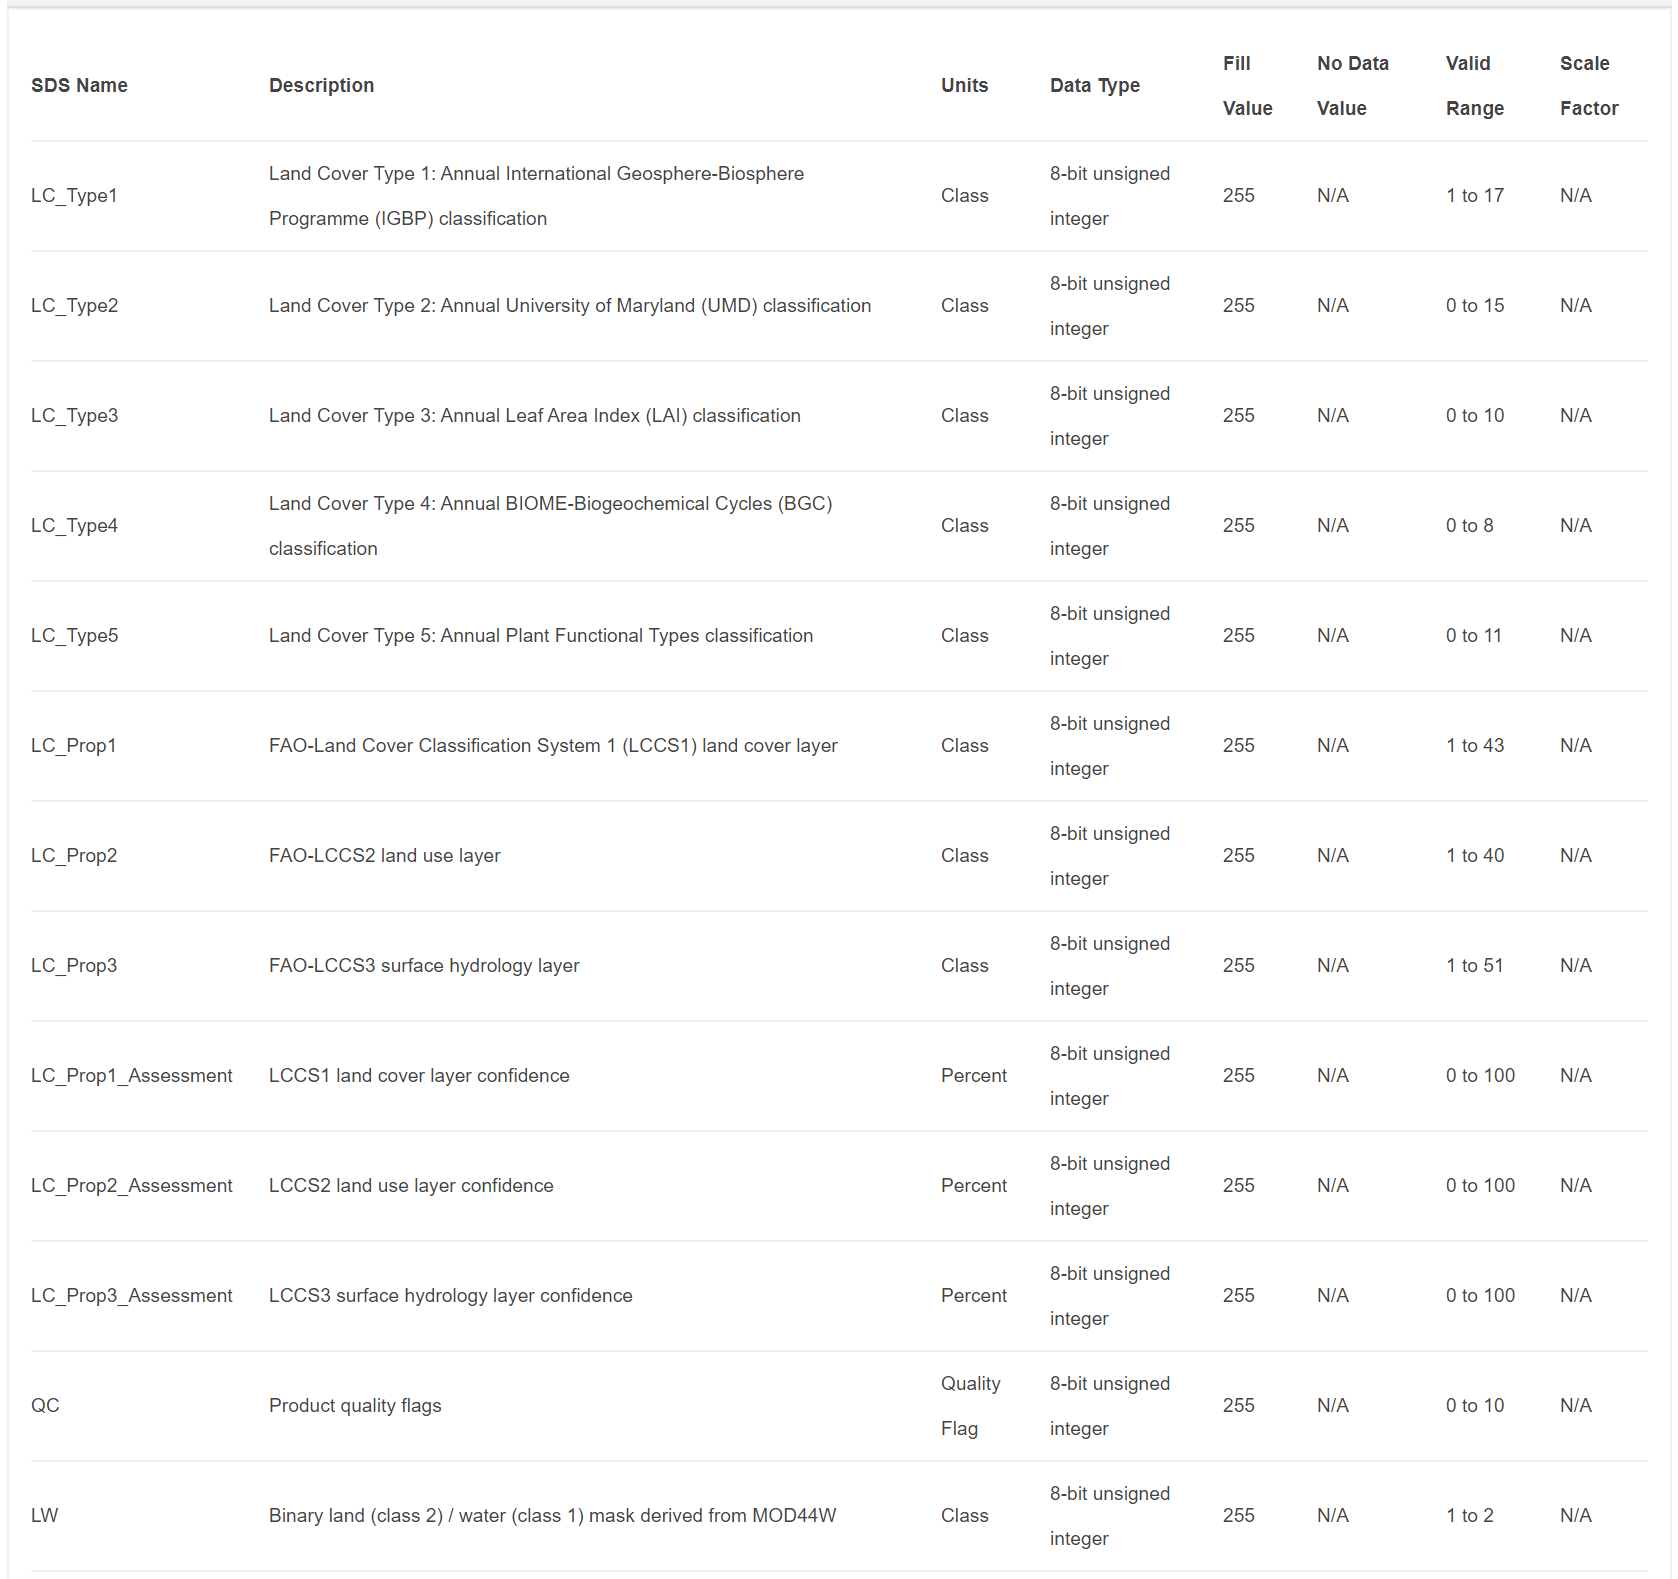
数据类型如图所示

2. 利用LC_Type1这个数据进行统计

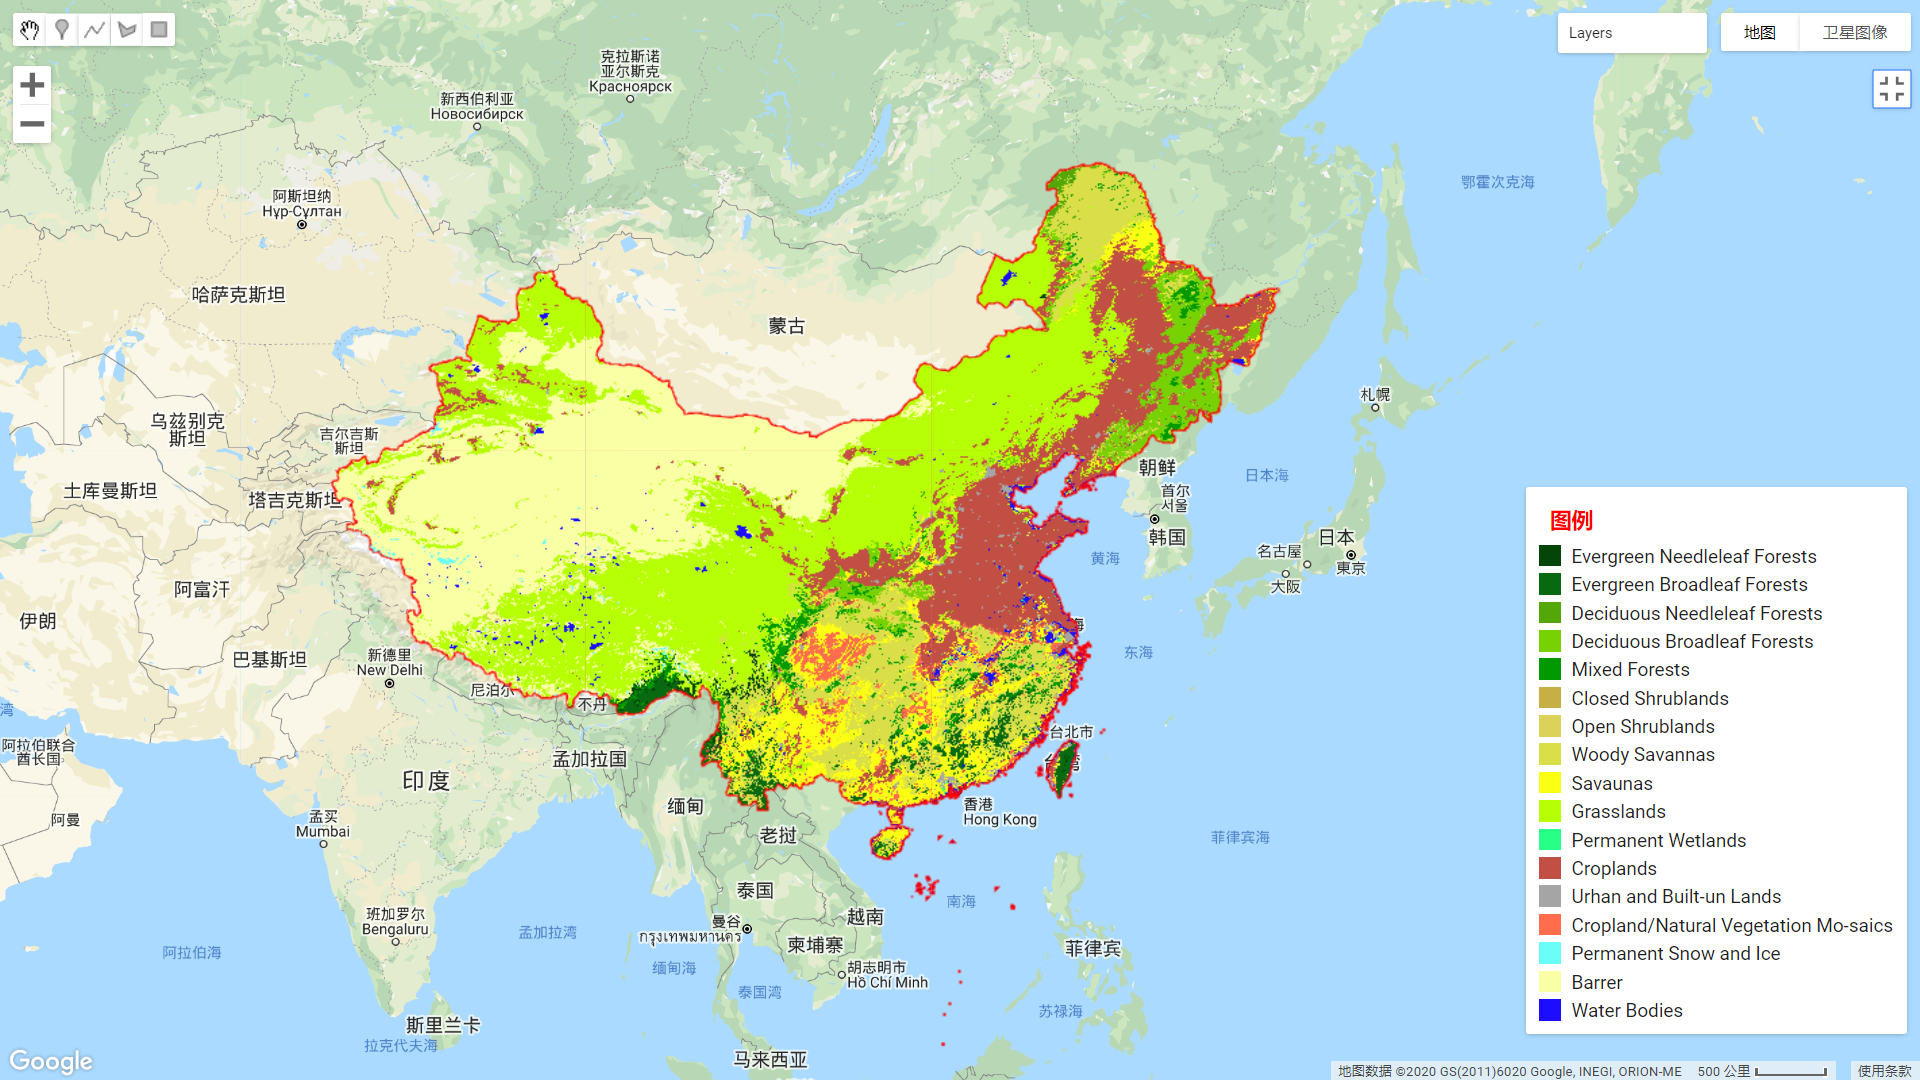
3. 在GEE上画图展示土地类型情况

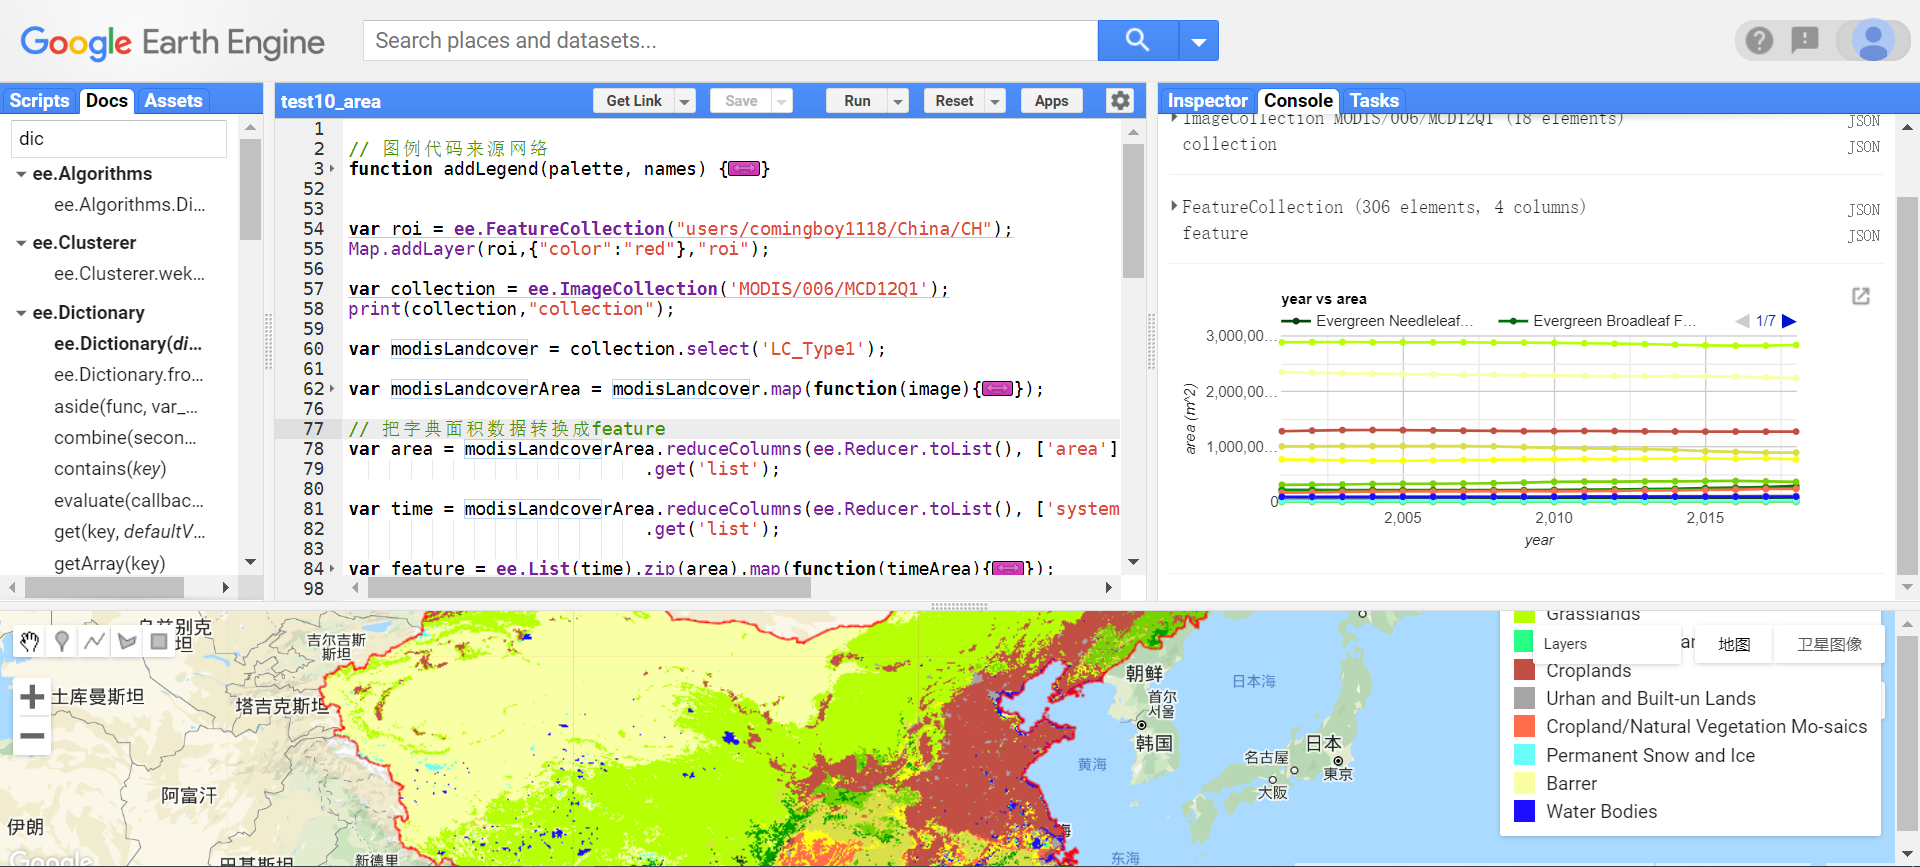
4. 统计不同土地类型的面积

5. 案例代码
// 图例代码来源网络

function addLegend(palette, names) {

//图例的底层Panel

var legend = ui.Panel({

style: {

position: 'bottom-right',

padding: '5px 10px'

}

});

//图例标题

var title = ui.Label({

value: '图例',

style: {

fontWeight: 'bold',

color: "red",

fontSize: '16px'

}

});

legend.add(title);

//添加每一列图例颜色以及说明

var addLegendLabel = function(color, name) {

var showColor = ui.Label({

style: {

backgroundColor: '#' + color,

padding: '8px',

margin: '0 0 4px 0'

}

});

var desc = ui.Label({

value: name,

style: {margin: '0 0 4px 8px'}

});

//颜色和说明是水平放置

return ui.Panel({

widgets: [showColor, desc],

layout: ui.Panel.Layout.Flow('horizontal')

});

};

//添加所有的图例列表

for (var i = 0; i < palette.length; i++) {

var label = addLegendLabel(palette[i], names[i]);

legend.add(label);

}

Map.add(legend);

}

var roi = ee.FeatureCollection("users/comingboy1118/China/CH");

Map.addLayer(roi,{"color":"red"},"roi");

var collection = ee.ImageCollection('MODIS/006/MCD12Q1');

print(collection,"collection");

var modisLandcover = collection.select('LC_Type1');

var modisLandcoverArea = modisLandcover.map(function(image){

var area = ee.Image.pixelArea().addBands(image).reduceRegion({

reducer: ee.Reducer.sum().group({

groupField: 1,

groupName: "LC_Type1"

}),

geometry: roi,

scale: 5000,

maxPixels:10e15,

});

var image = image.set({"area":area});

return image;

});

// 把字典面积数据转换成feature

var area = modisLandcoverArea.reduceColumns(ee.Reducer.toList(), ['area'])

.get('list');

var time = modisLandcoverArea.reduceColumns(ee.Reducer.toList(), ['system:time_start'])

.get('list');

var feature = ee.List(time).zip(area).map(function(timeArea){

var time = ee.Date(ee.List(timeArea).get(0)).get("year");

var area = ee.List(timeArea).get(1);

area = ee.Dictionary(area).get("groups");

var feature = ee.List(area).map(function(dict){

dict = ee.Dictionary(dict);

var value = dict.values();

return ee.Feature(null, {

time: time,

land:value.get(0),

area:value.get(1)});

});

return feature;

});

feature = feature.flatten();

var feature = ee.FeatureCollection(feature);

print(feature,"feature");

var palette = [

'05450a', '086a10', '54a708', '78d203', '009900', 'c6b044', 'dcd159',

'dade48', 'fbff13', 'b6ff05', '27ff87', 'c24f44', 'a5a5a5', 'ff6d4c',

'69fff8', 'f9ffa4', '1c0dff'

]

var names = [ 'Evergreen Needleleaf Forests',

'Evergreen Broadleaf Forests',

'Deciduous Needleleaf Forests',

'Deciduous Broadleaf Forests',

'Mixed Forests',

'Closed Shrublands',

'Open Shrublands',

'Woody Savannas',

'Savaunas',

'Grasslands',

'Permanent Wetlands',

'Croplands',

'Urhan and Built-un Lands',

'Cropland/Natural Vegetation Mo-saics',

'Permanent Snow and Ice',

'Barrer',

'Water Bodies']

// 面积统计

var chart = ui.Chart.feature.groups(feature, "time", "area", "land")

.setSeriesNames({1:'Evergreen Needleleaf Forests',

2:'Evergreen Broadleaf Forests',

3:'Deciduous Needleleaf Forests',

4:'Deciduous Broadleaf Forests',

5:'Mixed Forests',

6:'Closed Shrublands',

7:'Open Shrublands',

8:'Woody Savannas',

9:'Savaunas',

10:'Grasslands',

11:'Permanent Wetlands',

12:'Croplands',

13:'Urhan and Built-un Lands',

14:'Cropland/Natural Vegetation Mo-saics',

15:'Permanent Snow and Ice',

16:'Barrer',

17:'Water Bodies'})

.setOptions({

title: 'area vs Landcover',

hAxis: {'title': 'year'},

vAxis: {'title': 'area (m^2)'},

pointSize: 3,

colors:['#05450a', '#086a10', '#54a708', '#78d203', '#009900', '#c6b044', '#dcd159',

'#dade48', '#fbff13', '#b6ff05', '#27ff87', '#c24f44', '#a5a5a5', '#ff6d4c',

'#69fff8', '#f9ffa4', '#1c0dff']

})

print(chart)

// 地图显示

var landcoverVisualization = {palette: palette, min: 1, max: 17, format: 'png'};

Map.setCenter(108, 28, 3);

Map.addLayer(modisLandcover.first().clip(roi), landcoverVisualization, 'MODIS landcover');

//添加图例

addLegend(palette, names);