1 数据说明
2 结果展示

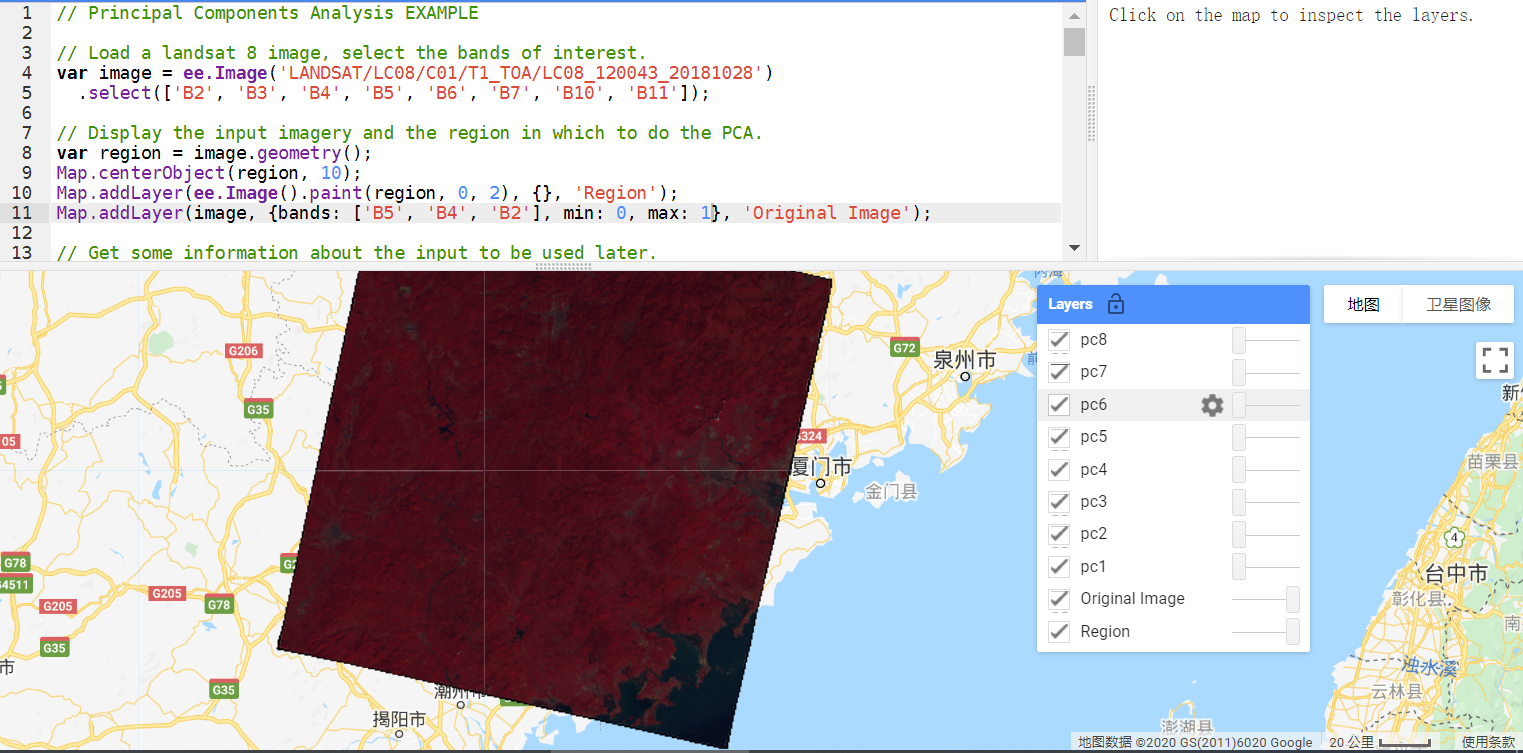
3 详细代码
// Principal Components Analysis EXAMPLE

// Load a landsat 8 image, select the bands of interest.

var image = ee.Image('LANDSAT/LC8_L1T/LC80440342014077LGN00')

.select(['B2', 'B3', 'B4', 'B5', 'B6', 'B7', 'B10', 'B11']);

// Display the input imagery and the region in which to do the PCA.

var region = image.geometry();

Map.centerObject(region, 10);

Map.addLayer(ee.Image().paint(region, 0, 2), {}, 'Region');

Map.addLayer(image, {bands: ['B5', 'B4', 'B2'], min: 0, max: 20000}, 'Original Image');

// Get some information about the input to be used later.

var scale = image.projection().nominalScale();

var bandNames = image.bandNames();

// Mean center the data to enable a faster covariance reducer

// and an SD stretch of the principal components.

var meanDict = image.reduceRegion({

reducer: ee.Reducer.mean(),

geometry: region,

scale: scale,

maxPixels: 1e9

});

var means = ee.Image.constant(meanDict.values(bandNames));

var centered = image.subtract(means);

// This helper function returns a list of new band names.

var getNewBandNames = function(prefix) {

var seq = ee.List.sequence(1, bandNames.length());

return seq.map(function(b) {

return ee.String(prefix).cat(ee.Number(b).int());

});

};

// This function accepts mean centered imagery, a scale and

// a region in which to perform the analysis.  It returns the

// Principal Components (PC) in the region as a new image.

// [START principal_components]

var getPrincipalComponents = function(centered, scale, region) {

// Collapse the bands of the image into a 1D array per pixel.

var arrays = centered.toArray();

// Compute the covariance of the bands within the region.

var covar = arrays.reduceRegion({

reducer: ee.Reducer.centeredCovariance(),

geometry: region,

scale: scale,

maxPixels: 1e9

});

// Get the 'array' covariance result and cast to an array.

// This represents the band-to-band covariance within the region.

var covarArray = ee.Array(covar.get('array'));

// Perform an eigen analysis and slice apart the values and vectors.

var eigens = covarArray.eigen();

// This is a P-length vector of Eigenvalues.

var eigenValues = eigens.slice(1, 0, 1);

// This is a PxP matrix with eigenvectors in rows.

var eigenVectors = eigens.slice(1, 1);

// Convert the array image to 2D arrays for matrix computations.

var arrayImage = arrays.toArray(1);

// Left multiply the image array by the matrix of eigenvectors.

var principalComponents = ee.Image(eigenVectors).matrixMultiply(arrayImage);

// Turn the square roots of the Eigenvalues into a P-band image.

var sdImage = ee.Image(eigenValues.sqrt())

.arrayProject([0]).arrayFlatten([getNewBandNames('sd')]);

// Turn the PCs into a P-band image, normalized by SD.

return principalComponents

// Throw out an an unneeded dimension, [[]] -> [].

.arrayProject([0])

// Make the one band array image a multi-band image, [] -> image.

.arrayFlatten([getNewBandNames('pc')])

// Normalize the PCs by their SDs.

.divide(sdImage);

};

// [END principal_components]

// Get the PCs at the specified scale and in the specified region

var pcImage = getPrincipalComponents(centered, scale, region);

// Plot each PC as a new layer

for (var i=0; i<bandNames.length().getInfo(); i++) {

var band = pcImage.bandNames().get(i).getInfo();

Map.addLayer(pcImage.select([band]), {min:-2, max:2}, band);

}
