1 数据说明
以下是对遥感图像进行时序处理,识别土地利用类型的变化的过程变化
为了方便展示,我把tif的图像变成了excel数据
由于这里只讲matlab作图,想详细了解以下方法的数据来源和处理,可以私聊
2 结果展示

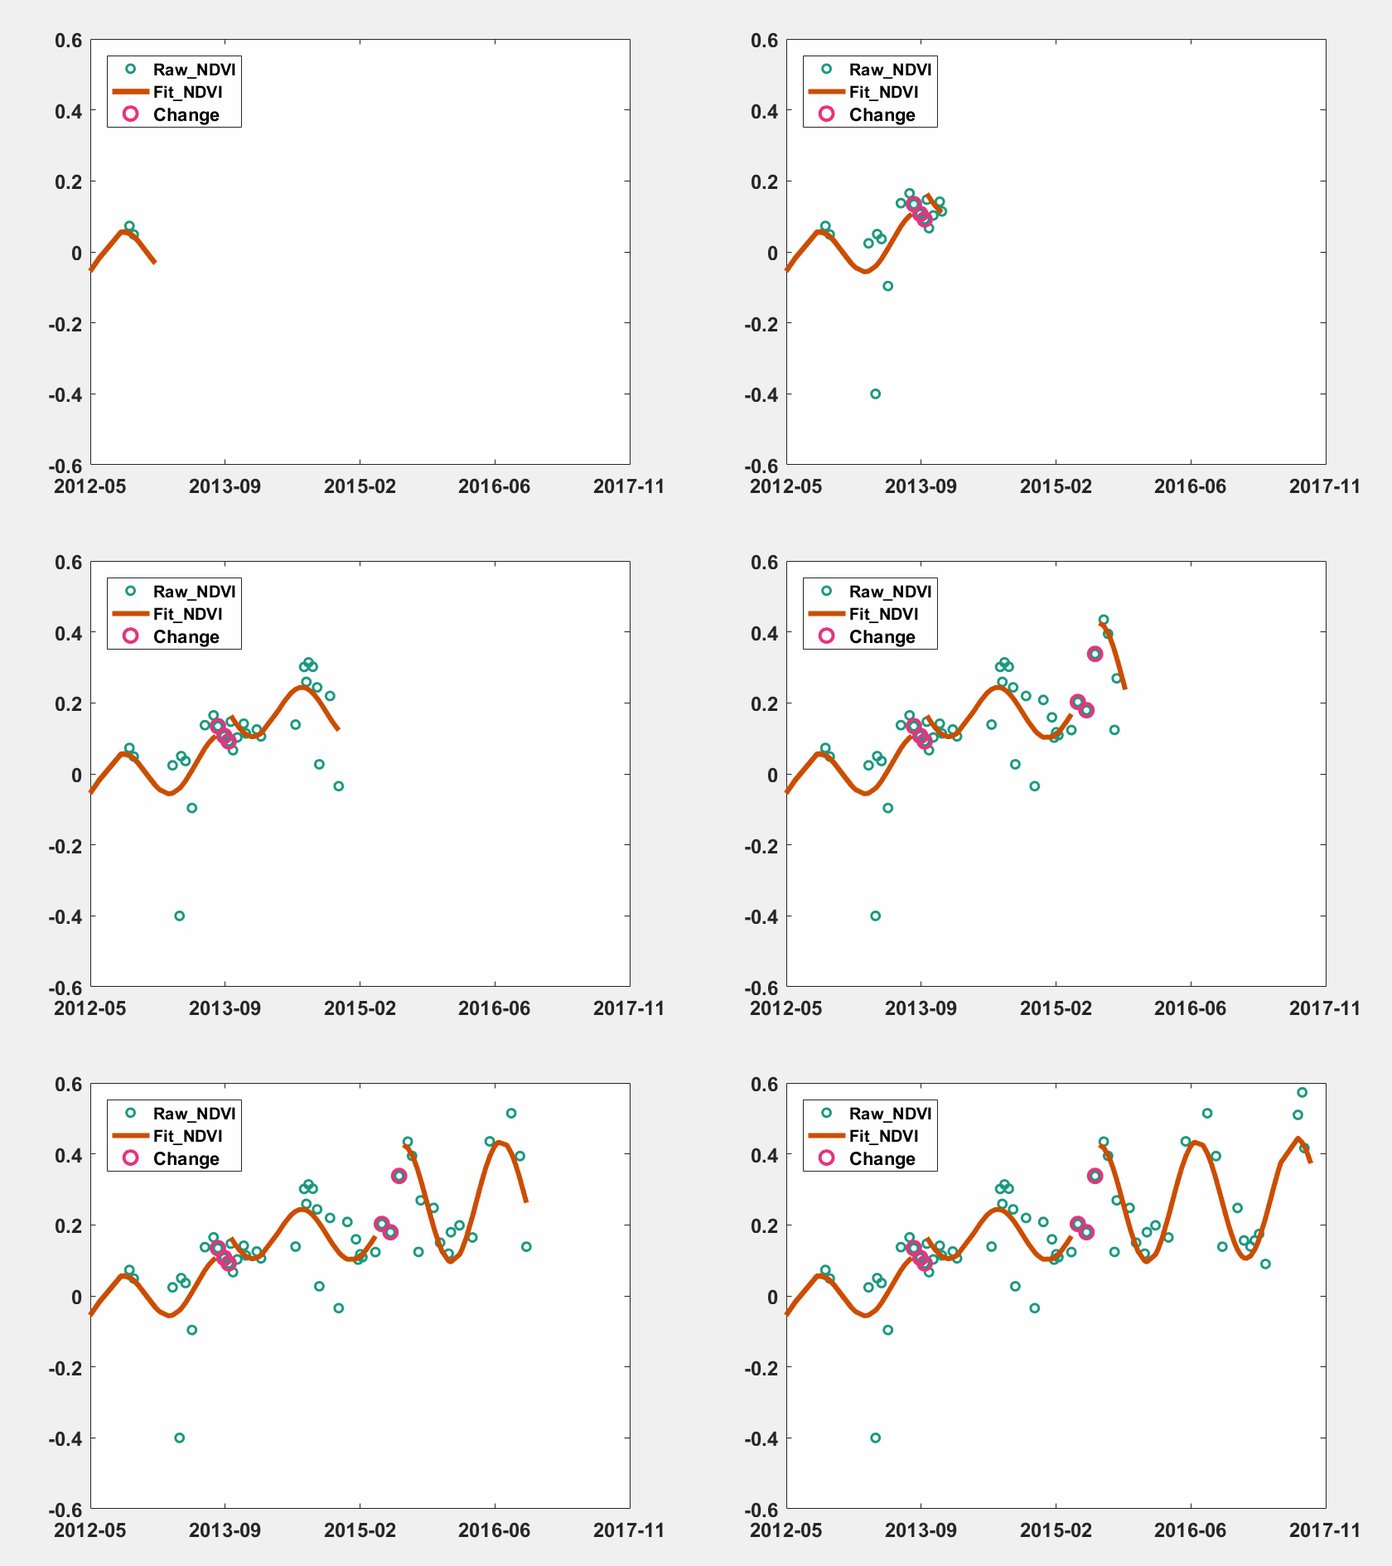
上图结果中,绿色圈圈代表遥感影像实际的观测值,棕色的线代码按照某种模型进行拟合,红色的圈圈代表拟合的线和实际观测的值持续3次相差太大,说明土地利用类型发生了变化,需要改变拟合的线
4 详细代码
file = 'spartina.xls';

[data,txt,raw]= xlsread(file);

time  = datenum(txt(2:end,1));

color = [0.1, 0.6, 0.5;0.8, 0.3, 0.0;0.9, 0.2, 0.5];

clf;

figure (1);

for i=25: size(data,1)-25 %为了展示更好的效果,去除了前25个数据和最后25个数据

tmp = data(1:i,:);

tmp2 = time(1:i);

h1 = plot(tmp2, tmp(:,2),'o','color',color(1,:),'MarkerSize',5,'linewidth',1.5);

hold on

h2 = plot(tmp2, tmp(:,6),'-','color',color(2,:),'MarkerSize',5,'linewidth',3);

hold on

h3 = plot(tmp2, tmp(:,12),'o','color',color(3,:),'MarkerSize',8,'linewidth',2);

set(gca,'xlim',[min(time),max(time)]);

datetick('x','yyyy-mm','keepticks');

set(gca,'ylim',[-0.6,0.6],'FontSize',12,'FontWeight','bold');

set(gca,'ytick',[-0.6,-0.4,-0.2,0,0.2,0.4,0.6],'FontSize',12,'FontWeight','bold');

legend([h1,h2,h3],{'Raw\_NDVI','Fit\_NDVI','Change'},'location','northwest')

f(i-24) = getframe(gcf);

frame=getframe(gcf);

im=frame2im(frame);%制作gif文件,图像必须是index索引图像

[I,map]=rgb2ind(im,256);

if i-24 == 1;

imwrite(I,map,'test02_spartina.gif','gif', 'Loopcount',inf);

else

imwrite(I,map,'test02_spartina.gif','gif','WriteMode','Append');

end

end

movie2avi(f,'test02_spartina.avi','fps',15,'quality',1,'compression', 'None');